
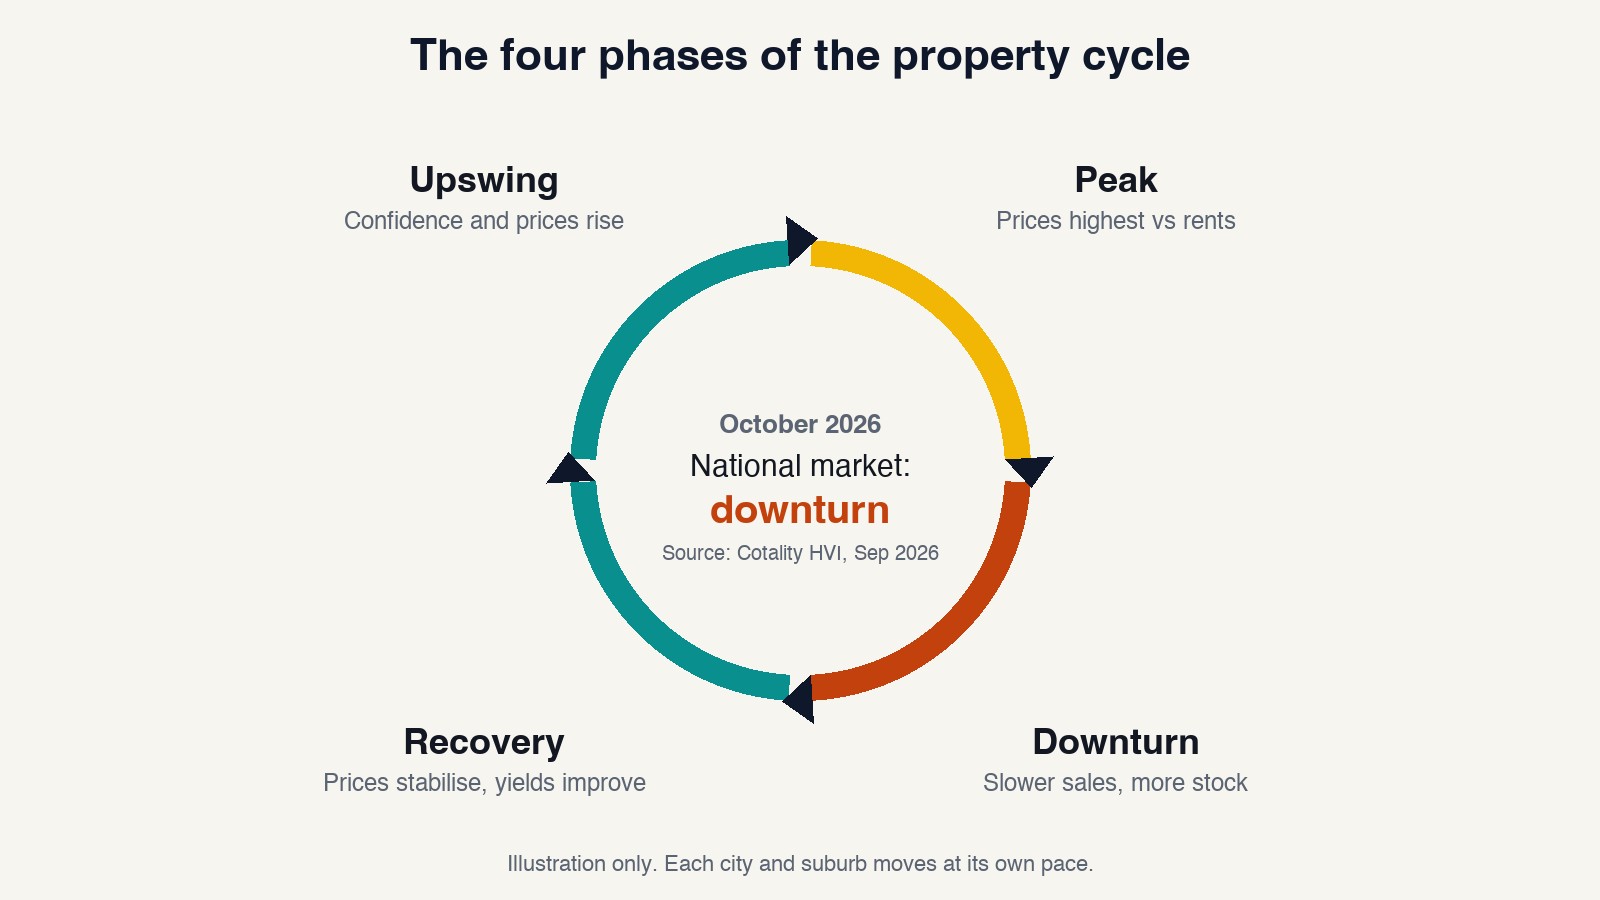
The Australian property cycle is the recurring pattern of recovery, upswing, peak and downturn that housing markets move through over time. As of October 2026, the national market is in a downturn: Cotality's Home Value Index fell for a sixth straight month in September, leaving values 5.2% below their March 2026 peak. Each city moves at its own pace.
Understanding the cycle will not tell you the perfect week to buy. It shows what tends to drive prices up and down, what to watch, and how to structure a purchase so it can be held through every phase. Liviti runs a licensed buyer's agency with off-market access.
Key takeaways
- The property cycle has four broad phases: recovery, upswing, peak and downturn.
- Nationally, values fell 1.1% in September 2026 and sit 5.2% below the March 2026 peak, according to Cotality.
- Different cities sit at different points: Brisbane and Sydney fell in September while Darwin rose.
- Interest rates, credit, supply, population and tax policy move the cycle, and they act at different speeds.
- Days on market, inventory, clearance rates and finance activity often shift before prices do.
The four phases of the property cycle
1. Recovery
After a downturn, prices flatten and then stabilise. Sentiment is still weak and sales volumes are low, but rental vacancy tightens and yields improve. Buyers have more choice and less competition.
2. Upswing
Confidence returns, homes sell faster and prices begin to rise. More buyers and investors enter the market, lenders become more willing, and new development is planned to meet demand.
3. Peak
Competition is at its strongest, prices are at their highest relative to rents, and media coverage is at its most positive. Affordability starts to bite and supply begins to catch up with demand.
4. Downturn
Higher rates, tighter credit, weaker confidence or new supply reduce demand. Homes take longer to sell, stock builds up and prices plateau or fall. The downturn eventually clears the excess and sets up the next recovery.
Where the Australian market sits in October 2026
Cotality's national Home Value Index fell 1.1% in September 2026, the sixth consecutive monthly fall. Values are now 5.2% below their record high from March 2026, and the national change over the past 12 months is 0.0%.
- Capital cities: Brisbane fell 1.5% in September, Sydney 1.4% and Melbourne 0.7%. Darwin was the only capital to rise, up 0.4%.
- Breadth: 97% of capital city suburbs fell in value over the three months to the end of September.
- Selling time: capital city homes took a median of 39 days to sell, up from 23 days a year earlier.
- Stock: total inventory across the combined capitals was 23.1% higher than a year ago.
Cotality attributes the slowdown to affordability constraints, higher interest rates, elevated living costs and weaker consumer sentiment. That places the national market in the downturn phase, with Darwin the clear exception. These figures change monthly; see Cotality's September 2026 release.
What drives the property cycle
- Interest rates and credit: rate changes and lending rules change how much buyers can borrow, and their effect can show up quickly.
- Supply: new homes take years to plan and build, so supply can arrive after demand has already cooled.
- Population and jobs: migration and employment growth add demand gradually, city by city.
- Tax and policy: the 2026 Budget limited full negative gearing on established homes bought after Budget night, which changes how investors approach the market. See property investment strategies in Australia for what that means for each approach.
- Confidence: sentiment tends to amplify each phase, pushing buyers in during upswings and keeping them out in downturns.
The property clock and its limits
The property clock is a way of showing the cycle as a clock face, with the bottom of the market at 6 o'clock, the upswing on the way to 12, the peak at 12 and the downturn on the way back to 6. The best-known Australian version is the property clock in Herron Todd White's monthly Month in Review, which places capital cities and regional markets on the clock each month.
The clock is a useful snapshot, but it has limits. It is built from recent sales and valuations, so it describes where a market has been. It places a whole city in one position when its suburbs and property types can be moving in different directions. And a clock suggests a fixed order and speed, while real markets can stall, reverse or skip ahead.
Is there an 18-year property cycle?
The 18-year property cycle, sometimes called the 18.6-year cycle, is a theory that land and property markets move through a long rise and fall roughly every 18 years. It appears often in forecasts of the next crash. It is a theory rather than a rule, because the forces that move prices, such as interest rates, lending policy and supply, do not run on a fixed timetable.
Indicators that show where a market is heading
Prices often move last. These measures tend to shift first:
- Days on market: homes selling faster point to rising demand; slower sales point to cooling. Across the capital cities this rose from 23 to 39 days in the year to September 2026.
- Inventory: falling stock tightens the market; rising stock gives buyers more leverage.
- Auction clearance rates: higher clearance rates signal more confident buyers.
- Finance activity: more new lending commitments mean more buyers ready to act.
- Rental vacancy and yields: tight vacancy and rising rents can lead a recovery.
Read them for the specific suburb and property type, not only the national figures. A city in a downturn can still contain pockets that are already recovering.
Using the cycle without trying to time it
The exact bottom and top of a cycle are usually only clear in hindsight. The cycle is more useful as a way to plan for every phase than as a timing tool. Planning for every phase usually comes down to:
- a property that can be held through a downturn, with a cash buffer for vacancies and rate rises
- a judgement of the local market, not the national headline
- fundamentals that outlast the cycle: land, location, transport, jobs and limited new supply
- a long hold, which leaves more time to ride out a downturn
A downturn also changes the conditions for buyers: more stock, longer selling times and less competition. Whether that suits you depends on your income, equity and time frame, so a buyer's agent or broker can assess the numbers for a specific purchase.
Reading the cycle suburb by suburb
National figures show the direction; a purchase depends on one street in one suburb. Liviti's licensed buyer's agency, with off-market access, works at that level. See how Liviti's buyer's agency works, or take the strategy scorecard to see where your portfolio stands.
Frequently asked questions
Where are we in the property cycle in 2026?
Nationally, in a downturn. Cotality's Home Value Index fell 1.1% in September 2026, the sixth monthly fall in a row, leaving values 5.2% below the March 2026 peak. Cities differ: Brisbane and Sydney recorded the largest falls in September, while Darwin rose 0.4%. Local suburbs can sit at a different point from their city.
How long does a property cycle last in Australia?
There is no fixed length. Each phase can be shorter or longer depending on interest rates, credit, supply and local economies, and different cities have run on very different timetables. That is why local indicators such as days on market and inventory are a better guide to where a market sits than any rule of thumb about cycle length.
What is the 18.6-year property cycle?
It is a theory that property and land markets move through a long rise and fall about every 18 years, and it often appears in crash forecasts. It is a theory rather than a rule, because interest rates, lending policy and supply do not follow a fixed timetable. Local indicators are a more reliable guide.
Is a downturn a good time to buy property?
A downturn usually means more stock, longer selling times and less competition, which can help buyers negotiate. It also means values can keep falling before they recover. The answer depends on whether the property suits a long hold and whether your cash flow can carry it through a slow period. A broker or buyer's agent can assess a specific purchase.